(주)휴원스는 뇌동맥 혈류 불균형 측정 핵심기술을 기반으로
글로벌 선도기업이 되기위해 노력합니다.
글로벌 선도기업이 되기위해 노력합니다.
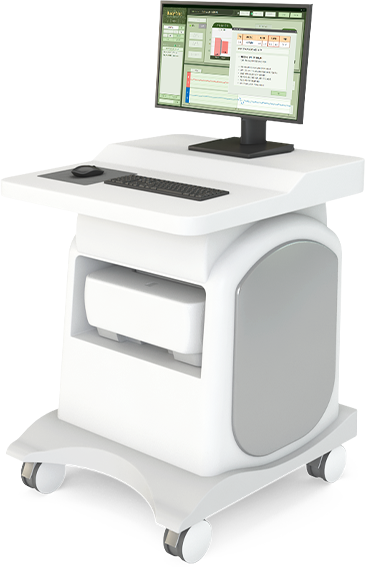
Body Mec Pro is a professional-grade measurement
device that simultaneously measures cerebral artery
blood flow imbalances, providing data for researching
physical condition and activity. It supports medical
professionals in monitoring abnormal cerebrovascular
signs and assists in clinical diagnosis by enabling experts
to analyze the data effectively.

Model Specification
| Specifications | Basic Functions | Comparison of Signal Amplitudes Before and After the Pulse in PPG Signals Measured from the Carotid Artery and Tibial Artery. |
| Supported OS | Windows 10 | |
| Programming language | Visual C# | |
| Resolution | 1920*1080 |
| Graph | Real-time PPG Graph | Ch1 Carotid Artery, Ch2 Tibial Artery PPG Graph |
| Graph View with X-axis Related Data | Automatic Range Update by Minute (or within a certainrange) Over Time | |
| PPG Magnitude Bar Graph | Carotid Artery (Before and After the Pulse), Tibial Artery (Before and After the Pulse) | |
| Bar Graph with Value Display | Displaying Pre-Pulse Values after Normalization | |
| BPM Bar Graph | BPM(Before and After the Pulse) |
| Graph Control | X | Axis Range Setting, Zoom In/Out |
| Y | Axis Range Setting, Zoom In/Out |
| Data | PPG Raw Data | PPG Raw Data save Ch1, Ch2. |
| Result Data | Save Result Data in Bar Graph | |
| Save Name | Subject_Date_Time | |
| Save Location | Save\Subject\ |
| Review | Select Data | Load or Explorer-style |
| Review Screen | The Measurement Screen and the Final Screen are the Same |
| Measurement | Connect/Disconnect Communication | Bluetooth Communication Connection - PPG Waveform Output |
| Enter Subject's Name | Generate Data Saved Under the Subject's Name | |
| Surgery Start/Complete | Measure and Automatically Save at the Start of Surgery | |
| Pulse Start Button | Button for Pre and Post-Pulse Discrimination | |
| Data Save Status | When Pressing the Surgery Completion Button, Confirm Data Save Status |